
TradFi Perpetuals
Funding Rate နဲ့ Perpetual Trading ကုန်ကျစရိတ် တွက်နည်း
Perpetual တစ်ခုကိုင်ထားရင် funding ပေးချေမှု၊ ဝင်ထွက်အခကြေးငွေ၊ ဈေးကွာဟချက်၊ ဈေးလျှောကျမှုနဲ့ အာမခံပစ္စည်းလဲလှယ်ခအထိ စုစုပေါင်းတွက်နည်း။
Perpetual position ၏ cost ကို entry trading fee တစ်ခုတည်းဖြင့် မတွက်နိုင်ပါ။ Funding payment၊ bid-ask spread၊ slippage၊ entry/exit fee၊ collateral conversion၊ liquidation buffer နှင့် collateral opportunity cost တို့ကိုထည့်မှ position ကို ကိုင်ထားရသည့် အမှန်တကယ်ကုန်ကျစရိတ်ကို မြင်နိုင်သည်။
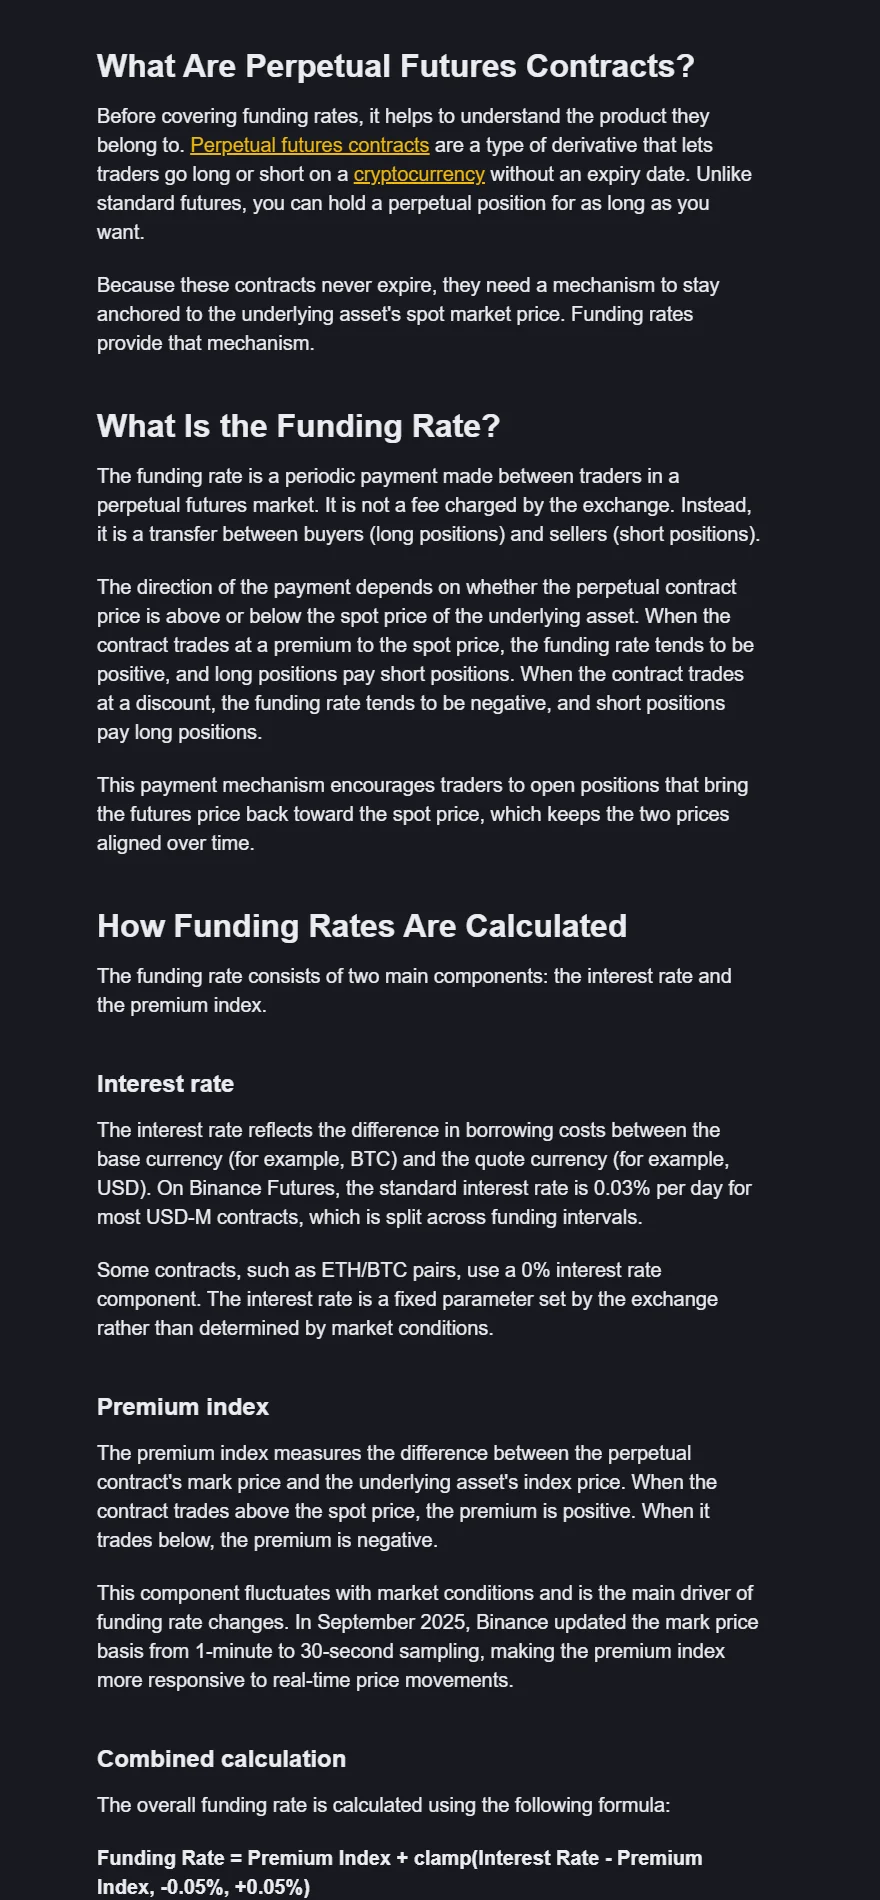
Binance Academy ၏ real funding-rate webpage screenshot။ Screenshot: 2026-08-27. Generic article ထက် သင့် contract page ရှိ live rate၊ interval နှင့် countdown ကို final input အဖြစ်ယူပါ။ Official source
Perpetual trading cost အလွှာများ
| Cost | ဘယ်အချိန်ဖြစ်သလဲ | ဘာပေါ်တွက်သလဲ |
|---|---|---|
| Entry trading fee | Position ဖွင့်ချိန် | Executed notional/fee tier |
| Bid-ask spread | ဝယ်/ရောင်းစျေးကွာမှု | Quantity နှင့် spread |
| Slippage | Order အဆင့်များစွာ fill ဖြစ်ချိန် | Expected price နှင့် average fill ကွာမှု |
| Funding | Funding timestamp ဖြတ်ချိန် | Position notional × rate |
| Exit trading fee | Position ပိတ်ချိန် | Executed notional/fee tier |
| Conversion/transfer | Collateral ပြောင်း/ရွှေ့ချိန် | Quoted rate၊ fee၊ network |
| Liquidation fee/loss | Forced liquidation ဖြစ်ချိန် | Platform rule နှင့် remaining margin |
| Collateral opportunity cost | Capital ကို margin အဖြစ်ပိတ်ထားချိန် | Alternative use နှင့် holding period |
“Fee နည်း” ဟုမြင်ရလည်း funding၊ spread နှင့် collateral volatility ကြောင့် all-in cost မြင့်နိုင်သည်။ Cost တစ်ခုချင်းကို entry မတိုင်မီနှင့် exit ပြီးနောက် နှစ်ကြိမ်မှတ်တမ်းတင်ပါ။
Funding rate ကို ရိုးရိုးရှင်းရှင်းနားလည်ရန်
Perpetual contract တွင် expiry date မရှိသောကြောင့် contract price ကို reference price နီးစပ်အောင် periodic funding mechanism သုံးသည်။ Binance Academy ၏ funding-rate guide အရ funding သည် long နှင့် short holder များကြား payment ဖြစ်ပြီး exchange trading fee မဟုတ်ပါ။
ပုံမှန်အားဖြင့်—
- Positive funding rate တွင် long က short ကိုပေးသည်။
- Negative funding rate တွင် short က long ကိုပေးသည်။
Direction၊ interval နှင့် capped rate ကို live contract page တွင်အတည်ပြုပါ။ Generic crypto perpetual အချို့တွင် interval ကို market condition အလိုက်ပြောင်းနိုင်သော်လည်း Binance stock perpetual guide ၏ 2026-04-23 snapshot အရ stock perpetuals များကို 8 နာရီတစ်ကြိမ် settle လုပ်ပြီး ±2.00% cap၊ interest component 0% ဟုဖော်ပြထားသည်။ Product specs ပြောင်းနိုင်သောကြောင့် historical article ထက် live funding tab ကိုဦးစားပေးပါ။
Funding ပေးချေမှု တွက်နည်း
Estimated funding payment = position notional × funding rate
Estimated total funding = interval တစ်ကြိမ်စီ၏ notional × interval တစ်ကြိမ်စီ၏ actual rate ကိုပေါင်းခြင်း
Position size နှင့် rate မပြောင်းဟုယူဆသည့် planning estimate အတွက်—
Planned funding ≈ current notional × assumed rate × expected funding intervals
သို့တွက်နိုင်သော်လည်း exact forecast မဟုတ်ပါ။ Rate direction ပြောင်းနိုင်သလို position ကို partial close/add လုပ်လျှင် notional ပြောင်းသည်။ Funding timestamp ရောက်ချိန် position ရှိမရှိကလည်း actual payment ကိုသက်ရောက်သည်။
Notional၊ margin နဲ့ leverage ကိုမရောပါနှင့်
Position notional = contract quantity × contract price
Effective leverage = position notional ÷ position ကိုထောက်ပံ့နေသော equity
Funding နှင့် trading fee ကို margin amount မဟုတ်ဘဲ notional ပေါ်တွက်နိုင်သည်။ Margin သည် collateral ဖြစ်ပြီး notional သည် market exposure ဖြစ်သည်။ Unrealized loss သို့မဟုတ် collateral value ကျသွားလျှင် equity လျော့ကာ effective leverage တက်နိုင်သည်။
UI တွင်ရွေးထားသည့် leverage slider သည် position ဖွင့်ချိန် setting ဖြစ်နိုင်သော်လည်း နောက်ပိုင်း actual leverage ကို notional/equity ဖြင့်ပြန်စစ်ရသည်။ Cross margin တွင် အခြား positions နှင့် wallet balance ပါသက်ရောက်နိုင်သည်။
Entry/exit trading fee တွက်နည်း
Trading fee = executed notional × applicable fee rate
Partial fills များကို fee tier သို့မဟုတ် maker/taker rule အလိုက် သီးခြားတွက်နိုင်သည်။ Order တစ်ခုတည်းတင်ထားသော်လည်း fill များစွာဖြစ်နိုင်ပြီး average entry price နှင့် total fee ကို trade history မှယူရသည်။
Limit order တင်ထားခြင်းတစ်ခုတည်းက maker fee ရမည်ဟု မဆိုလိုပါ။ Order ကချက်ချင်းရှိပြီးသား liquidity ကိုယူလျှင် taker ဖြစ်နိုင်သည်။ Fee schedule၊ VIP tier နှင့် promotion ကို current account screen မှစစ်ပါ။
Spread နဲ့ slippage တွက်နည်း
Quoted spread = ask − bid
Spread percentage ≈ (ask − bid) ÷ midpoint × 100
Buy slippage = average fill price − expected/reference price
Sell slippage = expected/reference price − average fill price
Slippage ကို last price နဲ့သာမနှိုင်းဘဲ order မတင်မီမှတ်ထားသော bid/ask သို့မဟုတ် chosen benchmark နဲ့နှိုင်းပါ။ Market ပိတ်ချိန်၊ news event နှင့် low-liquidity contract တွင် order book depth နည်းသဖြင့် small quoted spread ရှိနေသော်လည်း size ကြီးလာလျှင် slippage မြင့်နိုင်သည်။
Mark price၊ unrealized PnL နဲ့ realized PnL
Mark price ကို unrealized PnL နှင့် liquidation calculation တွင်သုံးနိုင်ပြီး last traded price နှင့်ကွာနိုင်သည်။ Position ပိတ်ချိန်တွင် estimate နှင့် actual reconciliation ကို အောက်ပါ mutually exclusive နည်းနှစ်မျိုးဖြင့်ခွဲပါ။
Trade မတိုင်မီ estimate = benchmark-based gross move − estimated execution shortfall (spread/slippage) − entry/exit fees − net funding paid − conversion/transfer cost
Trade ပြီးနောက် actual = actual average fill-to-fill trading PnL − entry/exit fees − net funding paid − conversion/transfer cost
Actual average fills ဖြင့် trading PnL တွက်ထားလျှင် spread/slippage သည် fill price ထဲပါပြီးသားဖြစ်သောကြောင့် ထပ်မနုတ်ပါနှင့်။ Platform UI ၏ “realized PnL” field တွင် fee သို့မဟုတ် funding ပါပြီးသားလားကို current statement definition ဖြင့်စစ်ပြီး ပါပြီးသား item ကိုထပ်မနုတ်ပါနှင့်။ Funding ကိုရရှိခဲ့ပါက net funding paid ကို negative cost အဖြစ်ထည့်နိုင်သော်လည်း price loss ထက် funding income ပိုမည်ဟု မအာမခံပါ။ Account statement နှင့် cash balance change မတူပါက fee၊ funding၊ transfer နှင့် other positions ကိုပြန်ချိန်ပါ။
Funding ရတာဆို risk-free မဟုတ်ပါ
Negative funding ရသော long သို့မဟုတ် positive funding ရသော short ဖြစ်နေလျှင် payment ရနိုင်သော်လည်း underlying price ဆန့်ကျင်ဘက်ရွေ့လျားမှုက funding income ထက်များနိုင်သည်။ Funding arbitrage ဟုခေါ်သော strategy များတွင်—
- Spot/perpetual basis မညီခြင်း
- နှစ်ဘက် entry/exit slippage
- Funding direction/rate ပြောင်းခြင်း
- Borrow သို့မဟုတ် conversion cost
- Collateral/liquidation risk
- Platform/custody risk
ရှိသည်။ “Long/short နှစ်ဘက်ထားလို့ market-neutral” ဆိုသည်ကို “capital-neutral” သို့မဟုတ် “risk-free” ဟု မဖတ်ပါနှင့်။
Collateral cost နဲ့ Multi-Assets Mode
Non-USDT crypto ကို collateral အဖြစ်သုံးပါက haircut သက်ရောက်နိုင်သည်။ Perpetual position ဆန့်ကျင်ဘက်ရွေ့နေချိန် collateral asset လည်းကျလျှင် margin ratio ပိုဆိုးနိုင်သည်။ Collateral ကို USDT သို့ပြောင်းမထားခြင်း၏ conversion saving ကိုသာမကြည့်ဘဲ collateral volatility နှင့် haircut ကိုပါထည့်ပါ။
Collateral အပိုထားခြင်းက liquidation buffer ပေးနိုင်သော်လည်း အန္တရာယ်မရှိသော “cost-free cash” မဟုတ်ပါ။ ထို capital ကို အခြားလိုအပ်ချက်အတွက်မသုံးနိုင်ခြင်း၊ platform exposure တိုးခြင်းနှင့် cross-margin contagion ကို opportunity/risk cost အဖြစ်မှတ်ပါ။
Liquidation က cost estimate ကို ဘာကြောင့်ဖျက်နိုင်သလဲ
Liquidation သည် planned exit မဟုတ်ပါ။ Mark price၊ maintenance margin tier၊ funding၊ wallet equity နှင့် liquidation engine ပေါ်မူတည်ပြီး manual stop မတိုင်မီ forced close ဖြစ်နိုင်သည်။ Gap သို့မဟုတ် low liquidity ကြောင့် realized loss က worksheet estimate ထက်ကြီးနိုင်သည်။
Liquidation fee သို့မဟုတ် residual balance treatment ကို platform rule မှစစ်ပါ။ “Maximum loss = initial margin” ဟု အမြဲမယူဆပါနှင့်—cross margin နှင့် shared collateral တွင် အခြား balance ပါသက်ရောက်နိုင်သည်။
Break-even ကိုတွက်ခြင်း
Required gross move for break-even ≈ estimated all-in round-trip cost ÷ position notional × 100
All-in cost ထဲတွင် entry/exit fee၊ spread/slippage၊ planned funding နှင့် conversion ကိုထည့်ပါ။ Holding period တိုးလာသလို funding interval များလာနိုင်ပြီး break-even move တိုးနိုင်သည်။ Rate direction ပြောင်းလျှင် worksheet ကို update လုပ်ပါ။
Expected price move က break-even ထက်နည်းနေပါက trade thesis မှန်သော်လည်း net result မကောင်းနိုင်သည်။ Forecast confidence တက်လာသည်ဆိုပြီး leverage ကိုကြီးမလုပ်ဘဲ cost နှင့် loss budget ကိုသီးခြားထိန်းပါ။
Collateral opportunity cost သည် trade statement ထဲမှ တိုက်ရိုက်နုတ်ထားသော cash cost မဟုတ်ဘဲ capital ကိုအခြားနေရာတွင်မသုံးနိုင်ခြင်း၏ economic cost ဖြစ်သည်။ Cash reconciliation နှင့်မရောဘဲ သီးခြား column ဖြင့်မှတ်ပါ။
Live contract screen မှယူရမည့် input
Cost estimate မစမီ contract page နှင့် account history မှအောက်ပါအချက်များကို timestamp နှင့်တကွမှတ်ပါ—
- Contract symbol၊ long/short နှင့် position quantity
- Current mark price နှင့် position notional
- Current funding rate၊ payment direction၊ next funding time နှင့် interval
- Entry/exit maker သို့မဟုတ် taker fee tier
- Order မတင်မီ bid/ask နှင့် expected execution benchmark
- Margin mode၊ collateral asset၊ haircut နှင့် effective leverage
- Actual fills၊ funding history နှင့် realized PnL statement
Current funding rate ကို future intervals အားလုံးအတွက်မကူးပါနှင့်။ Low/normal/stress scenario သုံးခုရေးပြီး funding timestamp တစ်ကြိမ်စီပြီးတိုင်း actual rate ဖြင့် update လုပ်ပါ။
Perpetual ကုန်ကျစရိတ် အစအဆုံး နမူနာတွက်ချက်မှု
အောက်ပါကိန်းများသည် တွက်နည်းပြသရန် assumptions ဖြစ်ပြီး live rate သို့မဟုတ် trade recommendation မဟုတ်ပါ။
| Input | Assumption |
|---|---|
| Position notional | 1,000 USDT |
| Entry fee | 0.05% = 0.50 USDT |
| Exit fee | 0.05% = 0.50 USDT |
| Funding | 0.01% × 3 intervals = 0.30 USDT paid |
| Entry spread/slippage | 0.80 USDT |
| Exit spread/slippage | 1.20 USDT |
| Collateral conversion/transfer | 0.40 USDT |
Estimated all-in round-trip cost = 0.50 + 0.50 + 0.30 + 0.80 + 1.20 + 0.40 = 3.70 USDT
Break-even gross move = 3.70 ÷ 1,000 × 100 = 0.37%
ဤနမူနာ၏ Gross PnL 6.00 USDT သည် spread/slippage မနုတ်ရသေးသော benchmark-based gross PnL ဟုသတ်မှတ်ထားသည်။ ထို့ကြောင့် estimated net result = 6.00 − 3.70 = 2.30 USDT ဖြစ်သည်။ Trade ပြီးနောက် actual fill-to-fill PnL သည် entry/exit execution shortfall 2.00 USDT ကိုထင်ဟပ်ပြီး 4.00 USDT ဖြစ်ပါက actual net = 4.00 − 0.50 − 0.50 − 0.30 − 0.40 = 2.30 USDT ဟုတွက်ပြီး spread/slippage ကိုထပ်မနုတ်ပါ။ Funding rate ပြောင်းခြင်း၊ partial fill၊ liquidation fee သို့မဟုတ် collateral loss ပါလာလျှင် ဤနမူနာကိုအသစ်ပြန်တွက်ရသည်။
ပြီးဆုံးသည့် worksheet တွင် estimate နှင့် actual column နှစ်ခုထားပါ။ Actual funding history၊ fill fee နှင့် realized PnL မကိုက်လျှင် position တစ်ခုတည်း၏ cost ဟုမခန့်မှန်းဘဲ အခြား position၊ transfer၊ conversion နှင့် shared cross-margin balance ကိုစစ်ပါ။
ကိုယ်တိုင်ဖြည့်တွက်ရန် ကုန်ကျစရိတ်ဇယား
- Contract၊ side နှင့် margin mode: ____
- Quantity နှင့် entry benchmark: ____
- Position notional: ____
- Entry fee rate/amount: ____
- Entry spread/slippage: ____
- Funding interval နှင့် next time: ____
- Assumed low/normal/stress funding rates: ____
- Expected intervals နှင့် total funding: ____
- Collateral asset/haircut: ____
- Exit fee နှင့် slippage estimate: ____
- Conversion/transfer cost: ____
- Total round-trip cost: ____
- Break-even percentage: ____
- Liquidation buffer: ____
Low၊ normal နှင့် stressed scenario သုံးခုဖြင့်တွက်ပြီး rate၊ spread နှင့် holding period ပြောင်းလျှင် worksheet ကိုပြန်လုပ်ပါ။ Exact future cost ဟု မယူပါနှင့်။
Position ကို ဆက်ကိုင်သင့်မသင့် စစ်ရန်
- Funding timestamp တိုင်းပြီးနောက် thesis နှင့် cost ကိုပြန်စစ်ပါ။
- Funding နည်းနေခြင်းကိုအကြောင်းပြပြီး position size မကြီးပါနှင့်။
- Market ပိတ်ချိန်၊ earnings နှင့် macro event မတိုင်မီ buffer စစ်ပါ။
- Exit order က reduce-only ဖြစ်မဖြစ် စစ်ပါ။
- Total accumulated cost သည် expected remaining move ထက်ကြီးလာသလား။
- Collateral asset က position နှင့်တစ်ပြိုင်နက်ကျနိုင်သလား။
- Live specification သို့မဟုတ် funding interval ပြောင်းသွားသလား။
Perpetual trading cost ကို တစ်ကြိမ်တွက်ပြီးမထားပါနှင့်။ Position notional၊ funding rate၊ holding period၊ collateral နှင့် liquidity ပြောင်းသလို all-in cost ကို update လုပ်ရသည်။ ဤအကြောင်းအရာသည် ပညာပေးရန်သာဖြစ်ပြီး funding strategy သို့မဟုတ် derivatives trade အကြံပြုချက် မဟုတ်ပါ။