
စတော့နှင့် ETF အခြေခံ
စတော့တစ်ခု မဝယ်ခင် ဘာတွေစစ်ဆေးသင့်သလဲ
စတော့မဝယ်ခင် SEC EDGAR မှာ ကုမ္ပဏီရဲ့ တရားဝင်အစီရင်ခံစာတွေ ရှာနည်း၊ ဝင်ငွေနဲ့ အမြတ်ကိန်းဂဏန်းတွေ တွက်နည်းနဲ့ သတိထားရမယ့်အချက်တွေကို ပြထားပါတယ်။
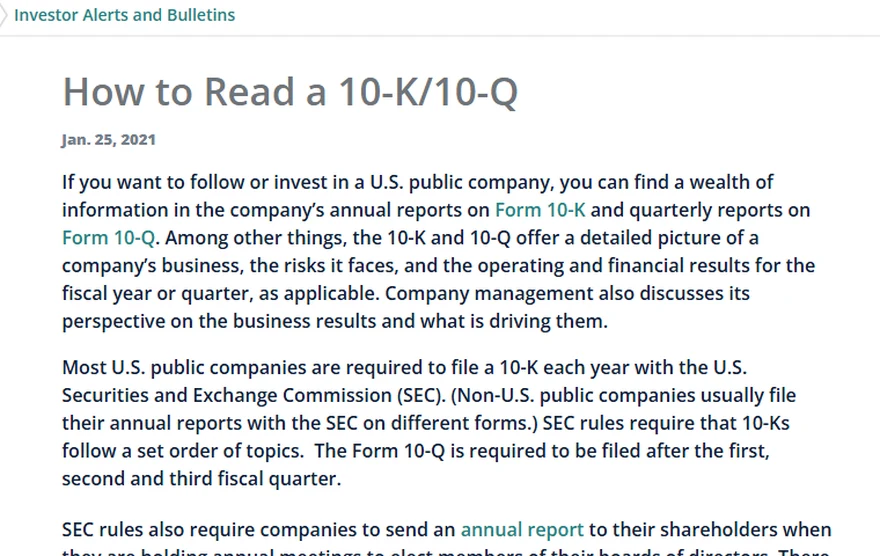
စတော့ရွေးချယ်ရာတွင် ticker နာမည်၊ လူမှုကွန်ရက် trend သို့မဟုတ် နောက်ဆုံးတက်သွားသော chart တစ်ခုတည်းကို မမှီခိုသင့်ပါ။ စတော့တစ်ခု၏စျေးနှုန်းသည် ကုမ္ပဏီ၏ အနာဂတ် cash flow၊ growth expectation နှင့် risk ကို စျေးကွက်က ယနေ့ ဘယ်လောက်တန်ဖိုးထားသလဲဆိုသည့် ရလဒ်ဖြစ်သည်။ အောက်ပါ checklist သည် “ဝယ်သင့်သောစတော့စာရင်း” မဟုတ်ဘဲ ကိုယ်တိုင်သုတေသနလုပ်ရန် လုပ်ငန်းစဉ်ဖြစ်သည်။
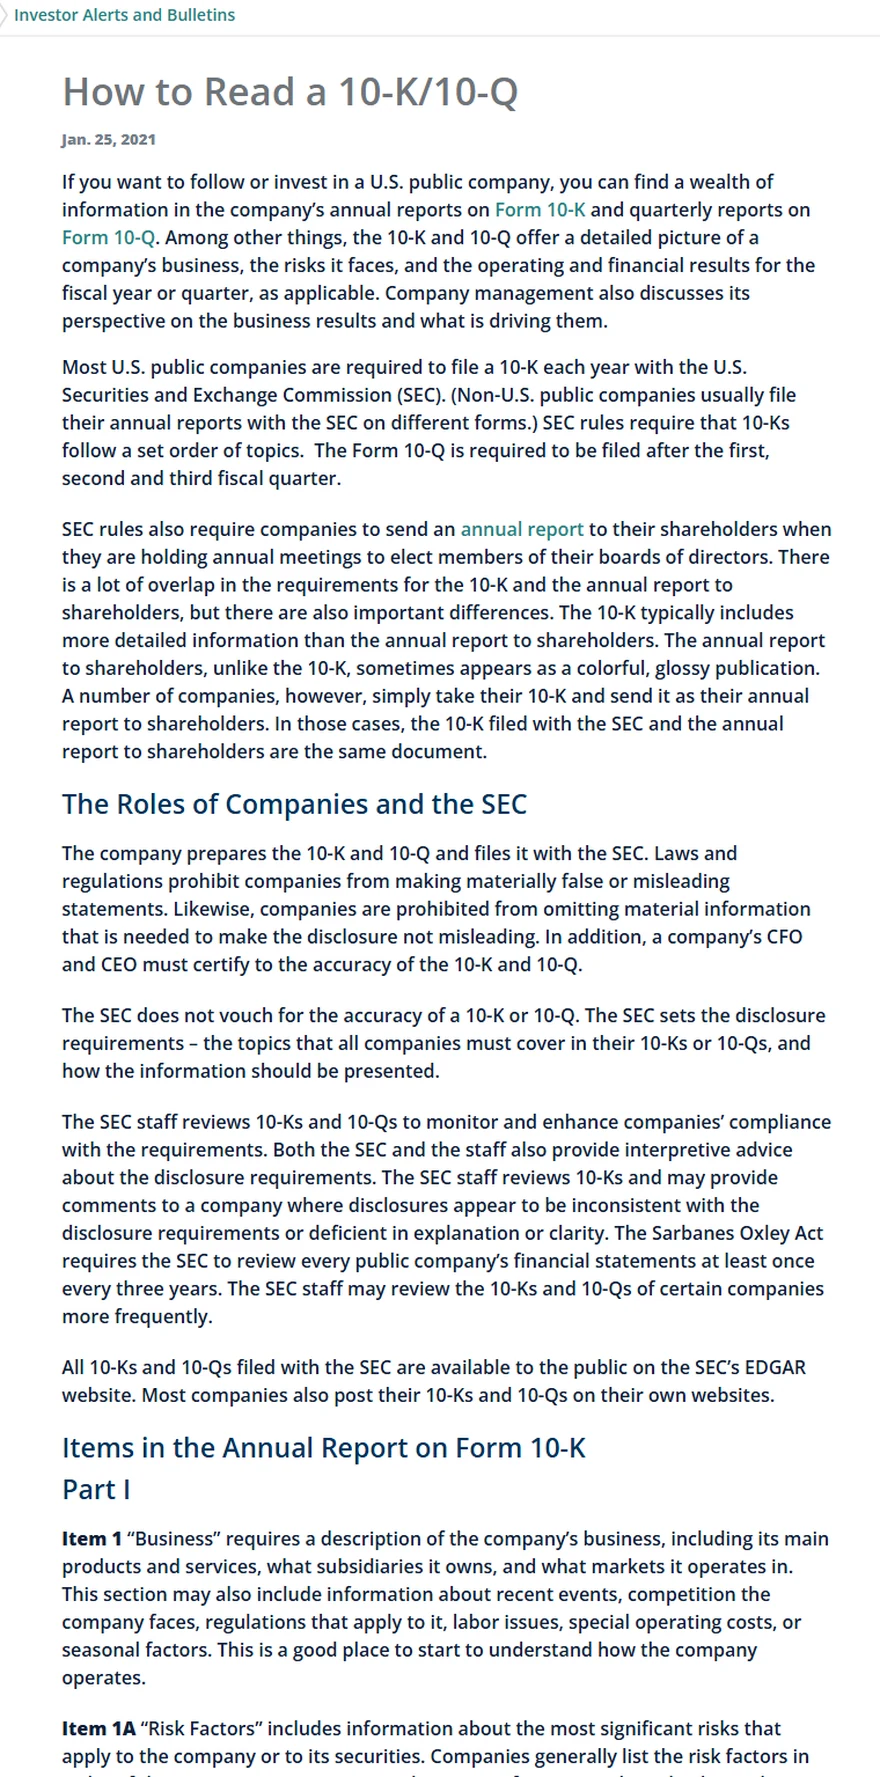
Investor.gov ၏ real webpage screenshot။ Screenshot: 2026-08-27. Guide သည် 2021-01-25 dated educational bulletin ဖြစ်ပြီး filing အစစ်ကို လက်ရှိ SEC EDGAR မှဖွင့်ရသည်။ SEC က disclosure requirements သတ်မှတ်သော်လည်း filing တစ်ခု၏ accuracy ကိုအာမခံပေးခြင်းမဟုတ်ပါ။ Official guide
စတင်မဖတ်ခင် research question သတ်မှတ်ပါ
“ဒီစတော့တက်မလား” ဟု မေးခြင်းထက် အောက်ပါမေးခွန်းသုံးခုဖြင့်စပါ။
- ကုမ္ပဏီက ဘယ်သူ့ပြဿနာကို ဘယ်လိုဖြေရှင်းပြီး ငွေရှာသလဲ။
- လက်ရှိစျေးနှုန်းက ဘယ် growth နှင့် margin expectation ကို ထည့်တွက်ထားသလဲ။
- ဘယ် evidence ထွက်လာလျှင် ကိုယ့် thesis မှားကြောင်း လက်ခံမလဲ။
မေးခွန်းရှင်းလင်းလျှင် data စုရုံဖြင့်မပြီးဘဲ data တစ်ခုချင်းက ဆုံးဖြတ်ချက်ကို ဘယ်လိုပြောင်းမလဲဆိုတာ သိနိုင်သည်။
1. ကုမ္ပဏီက ဘယ်လိုငွေရှာသလဲ
Product၊ customer နှင့် payment model ကို တစ်ကြောင်းတည်းဖြင့် ရှင်းမပြနိုင်ပါက မဝယ်မီ ထပ်ဖတ်ပါ။ Revenue stream ဘယ်နှခုရှိသလဲ၊ customer တစ်စုတည်းကို အလွန်မှီခိုသလား၊ recurring revenue ရှိသလား စစ်ပါ။
Marketing page ထက် annual filing ၏ Business section ကို အရင်ဖတ်ပါ။ Revenue ရှိခြင်းနှင့် sustainable profit ရှိခြင်း မတူပါ။ ကုန်ပစ္စည်းရောင်းအားတက်သော်လည်း customer acquisition cost၊ warranty၊ infrastructure သို့မဟုတ် working-capital လိုအပ်ချက် မြင့်လာနိုင်သည်။
SEC EDGAR တွင် ကုမ္ပဏီ filing ကို ဘယ်လိုရှာပြီး တိုက်စစ်ရမလဲ
- SEC EDGAR Full Text Search ကိုဖွင့်ပြီး legal company name သို့မဟုတ် ticker ရိုက်ပါ။ Result ထဲတွင် company name၊ ticker နှင့် CIK ကိုသုံးခုလုံးတိုက်စစ်ပါ—နာမည်နီးကုမ္ပဏီမရောပါနှင့်။
- Form filter ဖြင့် 10-K၊ 10-Q၊ 8-K၊ DEF 14A ကိုသီးခြားရှာပါ။ 10-K/A၊ 10-Q/A၊ 8-K/A amendment ရှိမရှိလည်းစစ်ပါ။ NT 10-K/NT 10-Q တွေ့လျှင် late-filing notice အဖြစ်သီးခြားဖတ်ပါ။
- Filing date နှင့် reporting period / period of report ကိုသီးခြားမှတ်ပါ။ Latest filing date ဖြစ်ရုံနှင့် latest fiscal period မဟုတ်နိုင်ပါ။
- Filing page တွင် primary 10-K/10-Q/8-K document၊ filing index၊ exhibits နှင့် Inline XBRL view ကိုခွဲဖွင့်ပါ။ Financial table ၏ currency၊ thousands/millions unit၊ quarter/year columns ကိုမှတ်ပါ။
- Latest 10-K balance-sheet date ပြီးနောက် တင်ထားသော 10-Q/8-K အားလုံးကိုစစ်ပါ။ Acquisition၊ financing၊ management departure သို့မဟုတ် material agreement က annual snapshot ကိုပြောင်းနိုင်သည်။
- 10-Q သည် ပုံမှန်အားဖြင့် annual 10-K ကဲ့သို့ full-year audited statements မဟုတ်ပါ။ 8-K body/press-release exhibit ကိုလည်း audited data ဟုအလိုအလျောက်မယူပါနှင့်။ Auditor report၊ filing label နှင့် note ကိုဖတ်ပါ။
Research note တစ်ခုချင်းတွင် CIK၊ form၊ accession link၊ filing date၊ period end၊ page/item၊ unit နှင့် value ကိုမှတ်ထားပါ။
2. 10-K၊ 10-Q နဲ့ 8-K ကို ဘယ်လိုဖတ်မလဲ
Investor.gov ၏ 10-K လမ်းညွှန် အရ 10-K တွင် Business၊ Risk Factors၊ MD&A နှင့် audited financial statements ပါဝင်သည်။ EDGAR research guide မှ company name သို့မဟုတ် ticker ဖြင့် official filings ရှာနိုင်သည်။
| Filing | ဘာအတွက်ဖတ်မလဲ | သတိထားရမည့်အချက် |
|---|---|---|
| 10-K | နှစ်စဉ် business၊ risk၊ audited statements | Data က fiscal year အဆုံးအထိဖြစ်သည် |
| 10-Q | သုံးလပတ်ရလဒ်နှင့် လက်ရှိပြောင်းလဲမှု | Seasonality နှင့် quarter တစ်ခုတည်းကို မလွန်ကဲပါနှင့် |
| 8-K | Material event၊ management change၊ deal စသည့် update | Headline ထက် filing အပြည့်ဖတ်ပါ |
| DEF 14A | Executive pay၊ board၊ major ownership | Incentive နှင့် dilution ကိုကြည့်ပါ |
10-K ကို အစမှအဆုံးတန်းဖတ်ရန်မလိုပါ။ ပထမအကြိမ်တွင် Business → Risk Factors → MD&A → Financial Statements → Notes အစဉ်ဖြင့်ဖတ်ပြီး နားမလည်သည့် accounting item ကိုမှတ်ထားပါ။ Notes to financial statements ထဲတွင် debt maturity၊ segment detail၊ stock compensation နှင့် legal contingency ကဲ့သို့ headline တွင်မပါတတ်သောအချက်များရှိသည်။
3. Revenue၊ margin နဲ့ cash flow ကိုအချိန်ကာလအလိုက်ကြည့်ပါ
Quarter တစ်ခုတည်းက မလုံလောက်ပါ။ နှစ်အနည်းငယ်အတွင်း အောက်ပါတန်းများကို တူညီသော unit နှင့်ကြည့်ပါ။
- Revenue နှင့် year-over-year growth
- Gross margin နှင့် operating margin
- Net income
- Operating cash flow
- Capital expenditure
- Free cash flow
- Diluted shares outstanding
Revenue တက်သော်လည်း gross margin ဆက်ကျနေပါက pricing power သို့မဟုတ် product mix ကိုပြန်စစ်ရသည်။ Net income တက်သော်လည်း operating cash flow မလိုက်ပါက receivable၊ inventory၊ non-cash gain သို့မဟုတ် working capital ကိုကြည့်ပါ။ Free cash flow ကို operating cash flow − capital expenditure ဟုအကြမ်းတွက်နိုင်သော်လည်း sector အလိုက် maintenance နှင့် growth capex ခွဲရန်ခက်နိုင်သည်။
4. Balance sheet နဲ့ debt maturity ကို မမေ့ပါနှင့်
Cash၊ short-term investments၊ total debt၊ lease obligation နှင့် debt maturity schedule ကိုကြည့်ပါ။ Interest rate မြင့်လာလျှင် refinance cost တက်နိုင်သည်။ Current liability နှင့် operating cash flow ကို နှိုင်းယှဉ်ခြင်းက အနီးကပ်ငွေကြေးဖိအားကို နားလည်စေသည်။
Debt-to-equity ratio တစ်ခုတည်းဖြင့်မဆုံးဖြတ်ပါနှင့်။ Bank၊ utility၊ software နှင့် manufacturer တို့၏ capital structure မတူပါ။ Debt covenant၊ variable-rate debt၊ collateral နှင့် maturity တစ်နှစ်ထဲတွင် စုပြုံနေမနေကို notes မှစစ်ပါ။
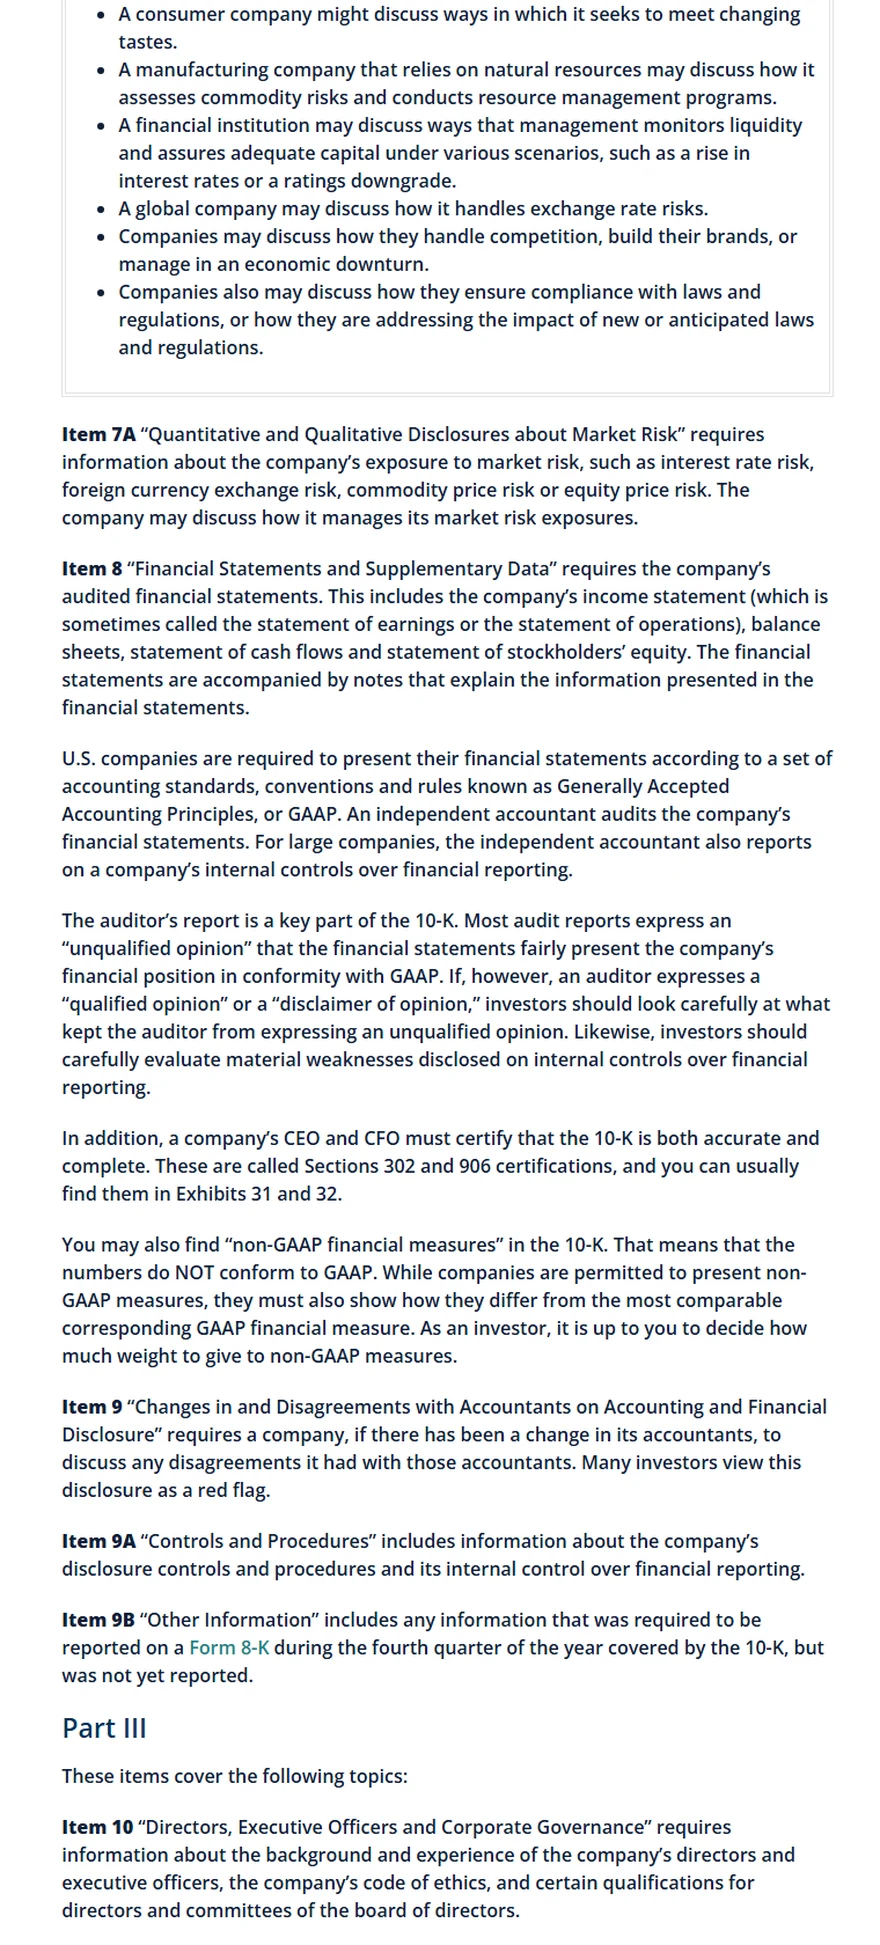
Investor.gov ၏ real webpage screenshot။ Screenshot: 2026-08-27. Red flag တစ်ခုတွေ့ရုံဖြင့် conclusion မချဘဲ filing note၊ auditor wording၊ amendment နှင့် management response ကိုအပြည့်ဖတ်ပါ။ Official source
ကုမ္ပဏီတစ်ခုကို တူညီသောကာလဖြင့် တွက်ကြည့်ခြင်း
အောက်ပါကိန်းများသည် တစ်ကုမ္ပဏီ၊ တစ် fiscal year၊ တူညီသော currency/unit ဖြင့် research sheet တည်ဆောက်ပုံကိုပြရန် teaching assumptions သာဖြစ်ပြီး real company recommendation မဟုတ်ပါ။
| Metric | Calculation |
|---|---|
| Revenue growth | (1,000m − 800m) ÷ 800m × 100% = 25% |
| Gross margin — prior/current | 360m ÷ 800m = 45%; 400m ÷ 1,000m = 40% |
| Margin change | 40% − 45% = −5 percentage points |
| Free cash flow approximation | OCF 120m − capex 70m = 50m |
| Net debt | debt 500m − cash 200m = 300m |
| Share dilution | (110m − 100m) ÷ 100m × 100% = 10% |
| Market cap | price 30 × current shares outstanding 110m = 3,300m |
| Enterprise value | 3,300m + debt 500m − cash 200m = 3,600m |
| Diluted EPS | net income 150m ÷ diluted weighted-average shares 110m = 1.364 |
| P/E | price 30 ÷ EPS 1.364 ≈ 22.0x |
| EV/EBITDA | 3,600m ÷ EBITDA 300m = 12.0x |
| FCF yield | 50m ÷ 3,300m × 100% ≈ 1.52% |
Market cap အတွက် period-end/current shares outstanding နှင့် EPS အတွက် diluted weighted-average shares သည် အဓိပ္ပာယ်မတူပါ။ ဤဥပမာတွင် နှစ်ခုလုံး 110m ဟုသီးခြားယူဆထားခြင်းသာဖြစ်သည်။ Quarter၊ TTM၊ fiscal-year data၊ GAAP/non-GAAP metric၊ currency နှင့် thousands/millions unit မတူတာကို တစ်ကြောင်းထဲမရောပါနှင့်။
Conclusion သည် “revenue +25%” တစ်ခုတည်းမဟုတ်ပါ—gross margin 5 points ကျခြင်း၊ dilution 10% နှင့် FCF yield 1.52% ကိုပါထည့်ပြီး ဘာကြောင့်ဖြစ်သည်ကို notes/MD&A မှပြန်စစ်ရသည်။
5. Valuation ကို growth နဲ့ quality တို့နှင့်တွဲကြည့်ပါ
P/E တစ်ခုတည်းနိမ့်ခြင်းက “စျေးပေါ” ဟု မဆိုလိုပါ။ Earnings ကျလာနေသည့်ကုမ္ပဏီတွင် P/E နိမ့်နိုင်သလို one-off gain ကြောင့် denominator မမှန်နိုင်သည်။ P/S၊ EV/EBITDA၊ free-cash-flow yield စသော metric များကို sector တူ peer များနှင့် နှိုင်းယှဉ်ပါ။ Bank၊ software နှင့် manufacturing ကို metric တစ်ခုတည်းဖြင့်မနှိုင်းပါနှင့်။
| Metric | အသုံးဝင်သည့်အခြေအနေ | အကန့်အသတ် |
|---|---|---|
| P/E | Positive၊ တည်ငြိမ်သည့် earnings | Loss-making firm သို့မဟုတ် one-off gain တွင် မသင့် |
| P/S | Profit မတည်ငြိမ်သေးသော growth business | Margin နှင့် debt ကိုမပြ |
| EV/EBITDA | Capital structure မတူသော peer များ | Capex နှင့် working capital ကိုလျှော့မြင်နိုင် |
| FCF yield | Cash generation နှင့် price ဆက်စပ်မှု | FCF တစ်နှစ်တည်း မတည်ငြိမ်နိုင် |
Valuation သည် forecast အပေါ်မူတည်သည်။ Base၊ optimistic နှင့် downside assumption များတွင် revenue growth၊ margin နှင့် share count ကို ဘာကြောင့်ရွေးထားသလဲရေးပါ။ အတိတ် growth ကို အနာဂတ်ထဲသို့ တန်းဆွဲမထားပါနှင့်။
6. Dilution၊ insider action နဲ့ incentive ကိုစစ်ပါ
Diluted shares outstanding နှစ်တိုင်းတိုးနေပါက သင့် ownership percentage လျော့နိုင်သည်။ Stock-based compensation၊ secondary offering၊ option exercise နှင့် convertible debt ကို စစ်ပါ။ Buyback ကြေညာချက်ထက် actual shares outstanding ကျမကျကိုကြည့်ပါ။
Insider buy/sell တစ်ခုတည်းက အချက်ပြမဟုတ်ပါ။ Sale သည် tax၊ diversification သို့မဟုတ် pre-arranged plan ကြောင့်ဖြစ်နိုင်သည်။ Official filing၊ transaction size နှင့် insider ၏ကျန်ရှိသော ownership ကိုတွဲကြည့်ပါ။ Executive bonus က revenue၊ adjusted earnings သို့မဟုတ် share-price target ဘာနဲ့ချိတ်ထားသလဲဆိုတာ proxy statement ထဲတွင်ဖတ်နိုင်သည်။
7. Competitor နဲ့ customer concentration ကိုနှိုင်းယှဉ်ပါ
ကုမ္ပဏီတစ်ခုတည်း၏ management presentation ကိုသာဖတ်လျှင် sector အခြေအနေကို မှားမြင်နိုင်သည်။ Peer နှစ်ခုသုံးခု၏ revenue growth၊ margin၊ capital intensity နှင့် valuation ကိုတူညီသော period ဖြင့်ချိန်ပါ။
Customer တစ်ဦး သို့မဟုတ် supplier တစ်ဦးက revenue/cost ၏ အရေးကြီးအပိုင်းယူထားပါက contract loss၊ renegotiation သို့မဟုတ် supply disruption သည် အခြားကုမ္ပဏီထက်ပိုထိခိုက်နိုင်သည်။ Segment နှင့် geographic revenue ကိုလည်းစစ်ပါ။
Filing red flags နဲ့ thesis-breakers
အောက်ပါအချက်တစ်ခုတွေ့လျှင် “အလိုအလျောက်မဝယ်” ဟုမဆုံးဖြတ်သေးဘဲ severity၊ duration၊ management response နှင့် follow-up filing ကိုစစ်ပါ—
- Auditor change၊ qualified/disclaimer opinion၊ going-concern warning
- Restatement၊ 10-K/A/10-Q/A amendment၊ material weakness in internal control
- NT 10-K/NT 10-Q late filing သို့မဟုတ် filing deadline ထပ်ကျော်ခြင်း
- Receivables/inventory growth က revenue ထက်ဆက်တိုက်မြန်ခြင်း
- နှစ်တိုင်းပြန်ပေါ်သော “one-time” adjustment နှင့် GAAP/non-GAAP reconciliation မရှင်းခြင်း
- Related-party transaction၊ legal contingency သို့မဟုတ် customer/supplier concentration
- Covenant breach၊ short-term liquidity gap သို့မဟုတ် debt maturity အများစုတစ်နှစ်တည်းစုခြင်း
- Share count/SBC ဆက်တိုးပြီး per-share result မတိုးခြင်း
- 8-K ထဲရှိ CEO/CFO/auditor departure၊ material agreement၊ financing သို့မဟုတ် asset sale
Final thesis sheet တွင် red flag 3 ခု၊ monitor metric 3 ခု၊ source/form/date နှင့် thesis-breaker 1–3 ခု ကိုမဖြစ်မနေရေးပါ။ အချက်တစ်ခုအတွက် source မရလျှင် “unknown” ဟုရေးပြီး valuation confidence ကိုလျှော့ပါ။
8. အန္တရာယ်ကို ကိုယ်ပိုင်စကားဖြင့် ရေးပါ
ကုမ္ပဏီ၏ official risk factors ကို copy မလုပ်ဘဲ အဓိက 3–5 ချက်ကို ကိုယ်ပိုင်စကားဖြင့်ရေးပါ—competition၊ regulation၊ supply chain၊ currency၊ key-person၊ cybersecurity သို့မဟုတ် customer concentration စသည်။ Risk တစ်ခုချင်းအတွက်—
- ဘယ် indicator ကိုစောင့်ကြည့်မလဲ။
- ဘယ် filing သို့မဟုတ် source မှသိနိုင်မလဲ။
- ဖြစ်လာလျှင် revenue၊ margin သို့မဟုတ် balance sheet ဘယ်လိုထိခိုက်မလဲ။
- ဘယ် evidence ရောက်လျှင် thesis ပျက်မလဲ။
ဟုရေးပါ။ “စျေးကျခြင်း” ကို business risk နှင့်မရောပါနှင့်။ စျေးကျခြင်းက outcome ဖြစ်ပြီး risk driver က earnings miss၊ dilution သို့မဟုတ် liquidity shock စသည့်အရာဖြစ်သည်။
9. Primary source ကို ဦးစားပေးပါ
အချက်အလက်အဆင့်ကို အောက်ပါအတိုင်းထားနိုင်သည်။
- Regulator/exchange filing နှင့် audited statement
- Company investor-relations material နှင့် earnings call transcript
- Reputable industry data သို့မဟုတ် established news report
- Analyst commentary
- Social post၊ influencer video သို့မဟုတ် AI summary
အောက်အဆင့် source က research idea ပေးနိုင်သော်လည်း number၊ date နှင့် quote ကို primary source ဖြင့်ပြန်စစ်ပါ။ AI က data ဟောင်း၊ ticker တူကုမ္ပဏီ၊ currency သို့မဟုတ် unit မှားနိုင်သည်။ Source link၊ filing date နှင့် page/section ကို research note တွင်မှတ်ထားပါ။
10. Order မပေးမီ thesis sheet တစ်မျက်နှာရေးပါ
- Business model: ____
- အဓိက revenue driver: ____
- Margin/cash-flow trend: ____
- Net cash သို့မဟုတ် debt position: ____
- Valuation metric နှင့် peer: ____
- အဓိက risk 3–5 ချက်: ____
- Thesis ပျက်စေမည့် evidence: ____
- Portfolio maximum size: ____
- Earnings/major event date: ____
- Source links နှင့် filing dates: ____
Binance Academy ၏ stock trading overview က fundamental analysis နှင့် technical analysis ကို ရည်ရွယ်ချက်မတူသောနည်းလမ်းများအဖြစ် ရှင်းပြထားသည်။ Fundamental analysis က “ဘာကို ဘယ်တန်ဖိုးဖြင့်ဝယ်နေသလဲ” ကို မေးပြီး technical analysis က price/volume behavior ကို လေ့လာသည်။ မည်သည့်နည်းလမ်းမှ အမြတ်အာမခံမပေးပါ။
Research note မရေးနိုင်သေးလျှင် order မပေးသေးခြင်းသည်လည်း ဆုံးဖြတ်ချက်ကောင်းတစ်ခုဖြစ်နိုင်သည်။ သုတေသနက risk ကိုပျောက်စေမည်မဟုတ်သော်လည်း မည်သည့်အကြောင်းကြောင့်ဝယ်ပြီး ဘယ်အချိန်တွင်အယူအဆပြောင်းရမည်ကို ရှင်းစေသည်။ ဤအကြောင်းအရာသည် ပညာပေးရန်သာဖြစ်ပြီး stock recommendation မဟုတ်ပါ။